A linear function makes a straight line when you graph it. The degree of the function is 1, which means that the highest exponent on any variable is 1.
Linear equations can be written in slope-intercept form:
y = mx + b
where
m is the slope. It tells you the gradient of the line (rise/run). Negative m means the slope goes down from left to right. Positive means the slope goes up from left to right.
b is the y-intercept. That’s where the line crosses the y-axis.
Think of the slope as “rise over run.” If the slope is 2, the line goes up 2 for every 1 step to the right. If it’s negative, the line goes down as you move right.
How to graph a line (step by step):
Start by plotting the y-intercept (the point where x = 0).
From that point, use the slope to find another point.
Example: slope = 3 means go up 3, right 1.
Example: slope = –2 means go down 2, right 1.
Draw a straight line through the points.
Here is a video illustrating slope-intercept form:
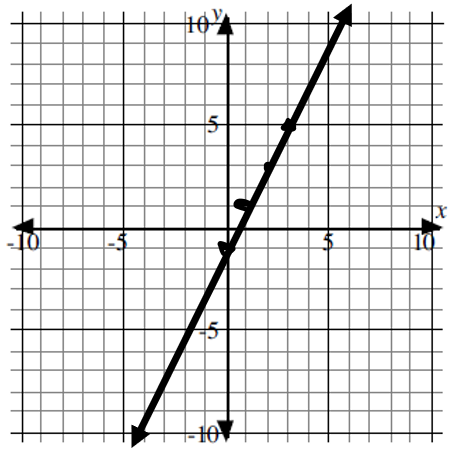
Example:
Equation: y = 2x – 1
Start at (0, –1) on the y-axis since -1 is the y-intercept.
Slope = 2 → up 2, right 1.
Mark the point (1, 1).
Connect the dots with a straight line.
Notice how every time you move 1 step to the right, the line goes up 2. That’s the slope in action.
Always ensure that your line is straight and extends to the ends of the graph.
A quadratic function makes a curve called a parabola. A quadratic equation has a degree of 2 (the highest exponent on the variables is 2). The general rule looks like this:
y = ax² + bx + c
a tells you if the parabola opens up (a > 0) or down (a < 0).
b and c shift the graph left, right, and up or down.
The most important point on a parabola is the vertex — the very bottom of the U if it opens up, or the very top if it opens down. The parabola is also symmetric, which means the left and right sides mirror each other.
How to graph a parabola (step by step):
Find the axis of symmetry: x = –b / (2a). This tells you the x-value of the vertex.
Plug that x into the equation to find the y-value. Now you know the vertex.
Plot the vertex.
Pick a couple of x-values to the left and right of the vertex, find their y-values, and plot those points.
Mirror the points across the axis of symmetry.
Connect with a smooth U-shape.
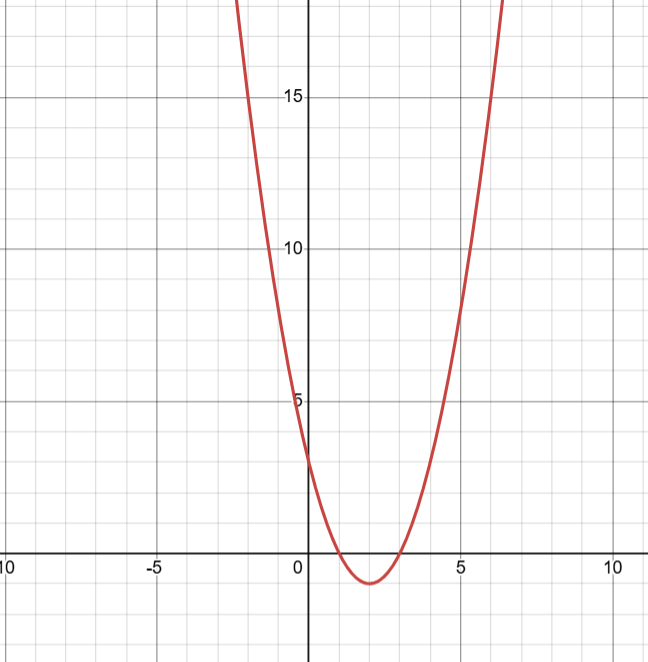
Example:
Equation: y = x² – 4x + 3
a = 1 (opens upward).
Axis: x = –(–4) / (21) = 2.
Plug in x = 2 → y = 4 – 8 + 3 = –1. Vertex = (2, –1).
Extra points:
x = 1 → y = 1 – 4 + 3 = 0 → point (1, 0).
x = 3 → y = 9 – 12 + 3 = 0 → point (3, 0).
Graph: vertex (2, –1), symmetric curve through (1, 0) and (3, 0).
Notice how the parabola dips down to (2, –1) and then climbs back up. That turning point is the vertex.
3. Comparing Linear vs Parabolic
Linear = straight line. It grows at a constant rate (always up the same amount for each step right).
Parabolic = U-shape. It grows slowly at first, then faster and faster (because of the squared term).
A linear equation has just one “slope.” A parabola has a changing slope — it’s steep on the sides, flat at the vertex.
These videos provide additional examples of graphing different types of equations:
For additional practice, try making equations on desmos.com.
Teacher Tips
Always start with the “special point.” For linear equations, that’s the y-intercept. For parabolas, that’s the vertex.
With parabolas, once you have one extra point, you automatically get its mirror image on the other side of the axis.
Linear is constant change; quadratic is accelerating change.
Quick Practice
Write the equation of the line with slope –2 and y-intercept 5.
Find the vertex of y = 2x² + 4x + 1.
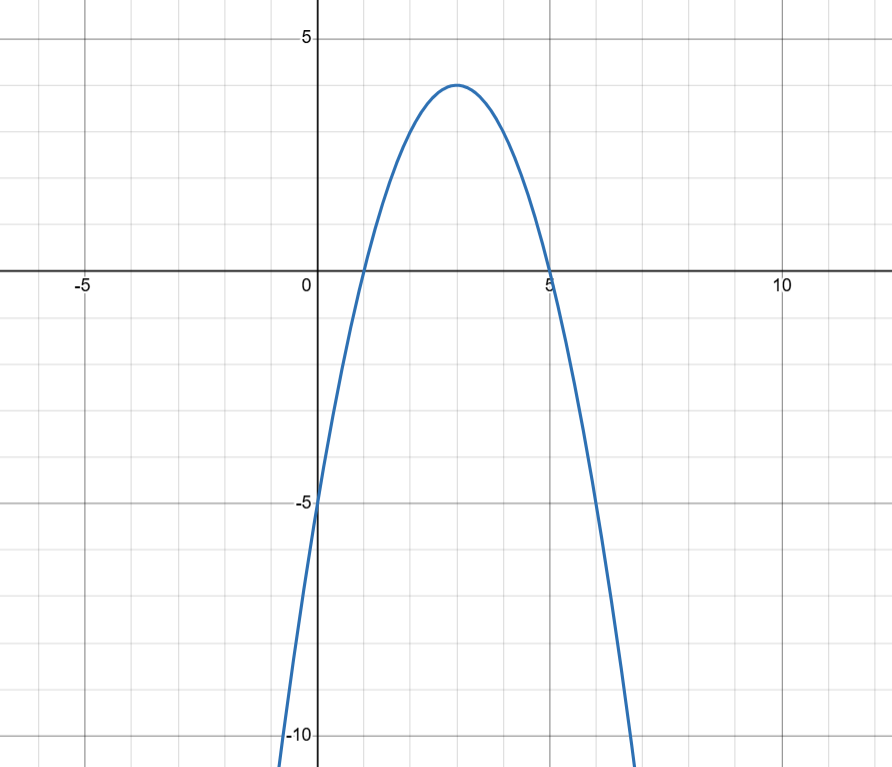
Graph y = –x² + 6x – 5: say if it opens up or down, and give the vertex.